|
|

|
  
Features
Update 2018/1/1
Water Advisory Report
WATER ADVISORY YEAR END REVIEW 2017:
QUÉBEC, FOURTH MOST ADVISORIES IN CANADA IN 2017, DOWN FROM SECOND IN 2016

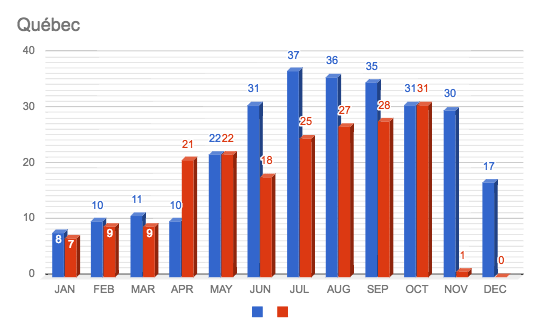
Blue-2016 Red-2017
This story is brought to you in part by Sourceia - Eco-houses
By Cori Marshall
One of the more significant water stories coming out of Québec in 2017 had to be the degree with which different regions in the southern part of the province were hit by flood water. The flooding was widespread, and significant portions of Montréal were inundated.
Back in May when WaterToday reported on the situation, 150 municipalities and over 1500 homes had been hit by the rising water. Unfortunately for homeowners, floods are not covered by private insurance companies. The Ministère de la sécurité publique (MSP) had put in place a financial aid program.
In some of the worst-hit areas some residents have yet to reintegrate into their homes, and in some cases, repair work has yet to begin.
The Ministère du Développement durable, de l'Environnement et de la Lutte contre les changements climatiques (MDDELCCC) published lists of the reported water advisories on their website.
In 2017 there were 198 reported water advisories of all types in Québec. This number is down 28.8% from the 278 advisories reported in 2016.
Québec is one of three provinces that saw advisory numbers drop in relation to 2016 figures. 2017 totals place Québec 4th in Canada for overall advisory numbers, down from having the second highest totals a year earlier. Its Central Canadian neighbour, Ontario, is more than 50 advisories behind.
The province averaged 16.5 advisories per month in 2017, down from the 23.2 average of a year ago. In 2016 there were six straight months where 30 or more advisories were reported, that number was only reached once this year.
In 2016 late autumn into early winter (November, December) totals remained high, while in 2017 numbers dropped to almost none. The chart illustrates that as the weather warms up advisory numbers rise, then drop off as temperatures fall.
October has a consistently high total, achieving 31 advisories in both 2016 and 2017. Late winter into early spring show relatively low advisory numbers.
Up next, we will finish our look at Central Canada as we look at the year that was in Ontario.
|
|
|
Have a question? Give us a call 613-501-0175
All rights reserved 2025 - WATERTODAY - This material may not be reproduced in whole or in part and may not be distributed,
publicly performed, proxy cached or otherwise used, except with express permission.
|
| |